Can you rebuild a closed-source trading indicator from someone else's screen?
 Sep 13, 2026

There’s a trend indicator I wanted on my charts. It’s invite-only, closed-source, and there’s no way in: no API, no source, no subscription I could buy. What it does have is a screen. Its author draws it on charts in a near-daily livestream, and every frame of that stream shows what the indicator computed for that bar.
So the question was whether that’s enough. Can you rebuild an indicator from nothing but what it displays on someone else’s screen?
Fourteen days later, the short answer is yes. The reconstruction, which I called Yerba, reproduces 36 of 37 historical readings across a dozen assets to the cent, and agrees with TradingView’s own engine to 0%. The longer answer is this post: what I decided, what the machine found, and the six or seven times a number looked right and wasn’t.
One thing to say up front. I’m not a developer. I’ve spent 20 years making operations run on technology, and the tool here was Claude Code, prompted every day for two weeks. The idea was mine, the loop was mine, and so were the calls. The arithmetic was the machine’s.
A reading is scarce and can’t be requested
The indicator is a trailing stop. In an uptrend it draws a line under price, in a downtrend a line above it, and the line only ever moves in the direction of the trend. When a bar closes through it, the trend flips and the line jumps to the other side. That’s the whole visible behavior, plus a small table in the corner of the chart with nine rows of its own numbers.
The constraint that shaped everything: I can’t ask it anything. A reading exists only because the streamer happened to have that chart open, on that day, with the cursor where it was. Ground truth arrives at his pace, not mine.
So on day one, before any code, I wrote the loop down in a note. Watch the stream daily. Screenshot every chart that has the indicator on it. Drop the screenshots in an inbox folder with the video URL, and let the model ingest: pull the transcript, extract what he claims, promote the repeatable claims to rules, and harvest every visible number into a row of ground truth (asset, date, level). When there are enough rows, write the first Pine Script. Keep feeding it, and let the model keep correcting itself.
The loop as designed on day one. It hasn’t changed. The one step that still needs a person is pasting a new script version into TradingView.
The loop serves two goals at once, on purpose. I want the trading rules well enough to trade them, and I want the indicator well enough to run it. Every video is knowledge for the first and labelled calibration data for the second, and one ingest pass harvests both. That coupling is what stops the project from decaying into two half-maintained folders.
One ground rule from the start: the reference’s product name appears nowhere I write. Not in code, filenames, commits, or prose, and a grep in the repo enforces it (the pattern is assembled at run time so the check itself never contains the name). The same rule applies to this post.
Day one: three assets at 0.00%, and a red herring
On August 31 the first sweep ran candidate engines against the first handful of observations, and one of them landed. The indicator is a SuperTrend on the bar’s midpoint. Plain version: take the average size of the last few bars (that’s the ATR), draw a band two of those away from the midpoint, let it ratchet one way, and flip when a bar closes through it. ATR length 10, multiplier 2.0, evaluated only on confirmed closes.
Three assets, three exchanges, three price magnitudes, same day:
| asset | feed | Yerba | reference | error |
|---|---|---|---|---|
| SOL | Coinbase | 65.8870 | 65.8900 | 0.00% |
| ETH | Bitfinex | 1709.3844 | 1709.3800 | 0.00% |
| XRP | Binance | 0.9711 | 0.9711 | 0.00% |
Three exact hits felt like the end of the problem. It was the end of the easy part.
The detail worth the space: the indicator’s own status line shows two visible inputs, 5 and 3. They look exactly like the ATR length and the multiplier. At length 5 the engine misses three of six flip dates, and one asset never flips at all. The most legible thing on the screen was the wrong thing, and the observations overruled it.
TAKEAWAY: let the data decide, not the label. The label is what someone chose to show you.
By that evening, the other assets missed by 8%, 20%, 26%.
Nine days for BTC, and a sweep that asked the wrong question
A 1,466-pair parameter sweep found nothing that fit everything, and the honest conclusion at the time was that the fix must be structural, something in the formula rather than in the numbers. That conclusion was wrong, and it cost nine days.
Length and multiplier both vary per chart. Multiplier 2.0 with length 10 fits SOL, ETH, XRP and SPX. Multiplier 2.0 with length 15 fits sixteen others. BTC is not a 2.0 asset at all and reproduces exactly at (10, 3.0). Nothing in the source material explains why, and that’s still the largest open question.
The part I keep coming back to is that the sweep had already found BTC’s answer on day one. Pairs like (8, 3.2) and (12, 2.8) landed within 0.04% with the flip bar right, and the whole family was dismissed because none of them was a round number. (10, 3.0) sits inside that family. It is a round number. The test that disqualified the family would have promoted it, if anyone had asked the family instead of the crowd. A sweep that asks whether one pair fits everything answers correctly and unhelpfully.
Two things broke the tie in the end: a fresh flip on BTC, which supplies an entry price where a bear window only ever tests the level, and a frame showing the reference’s stop sitting still for five weeks, which most of the family doesn’t do.
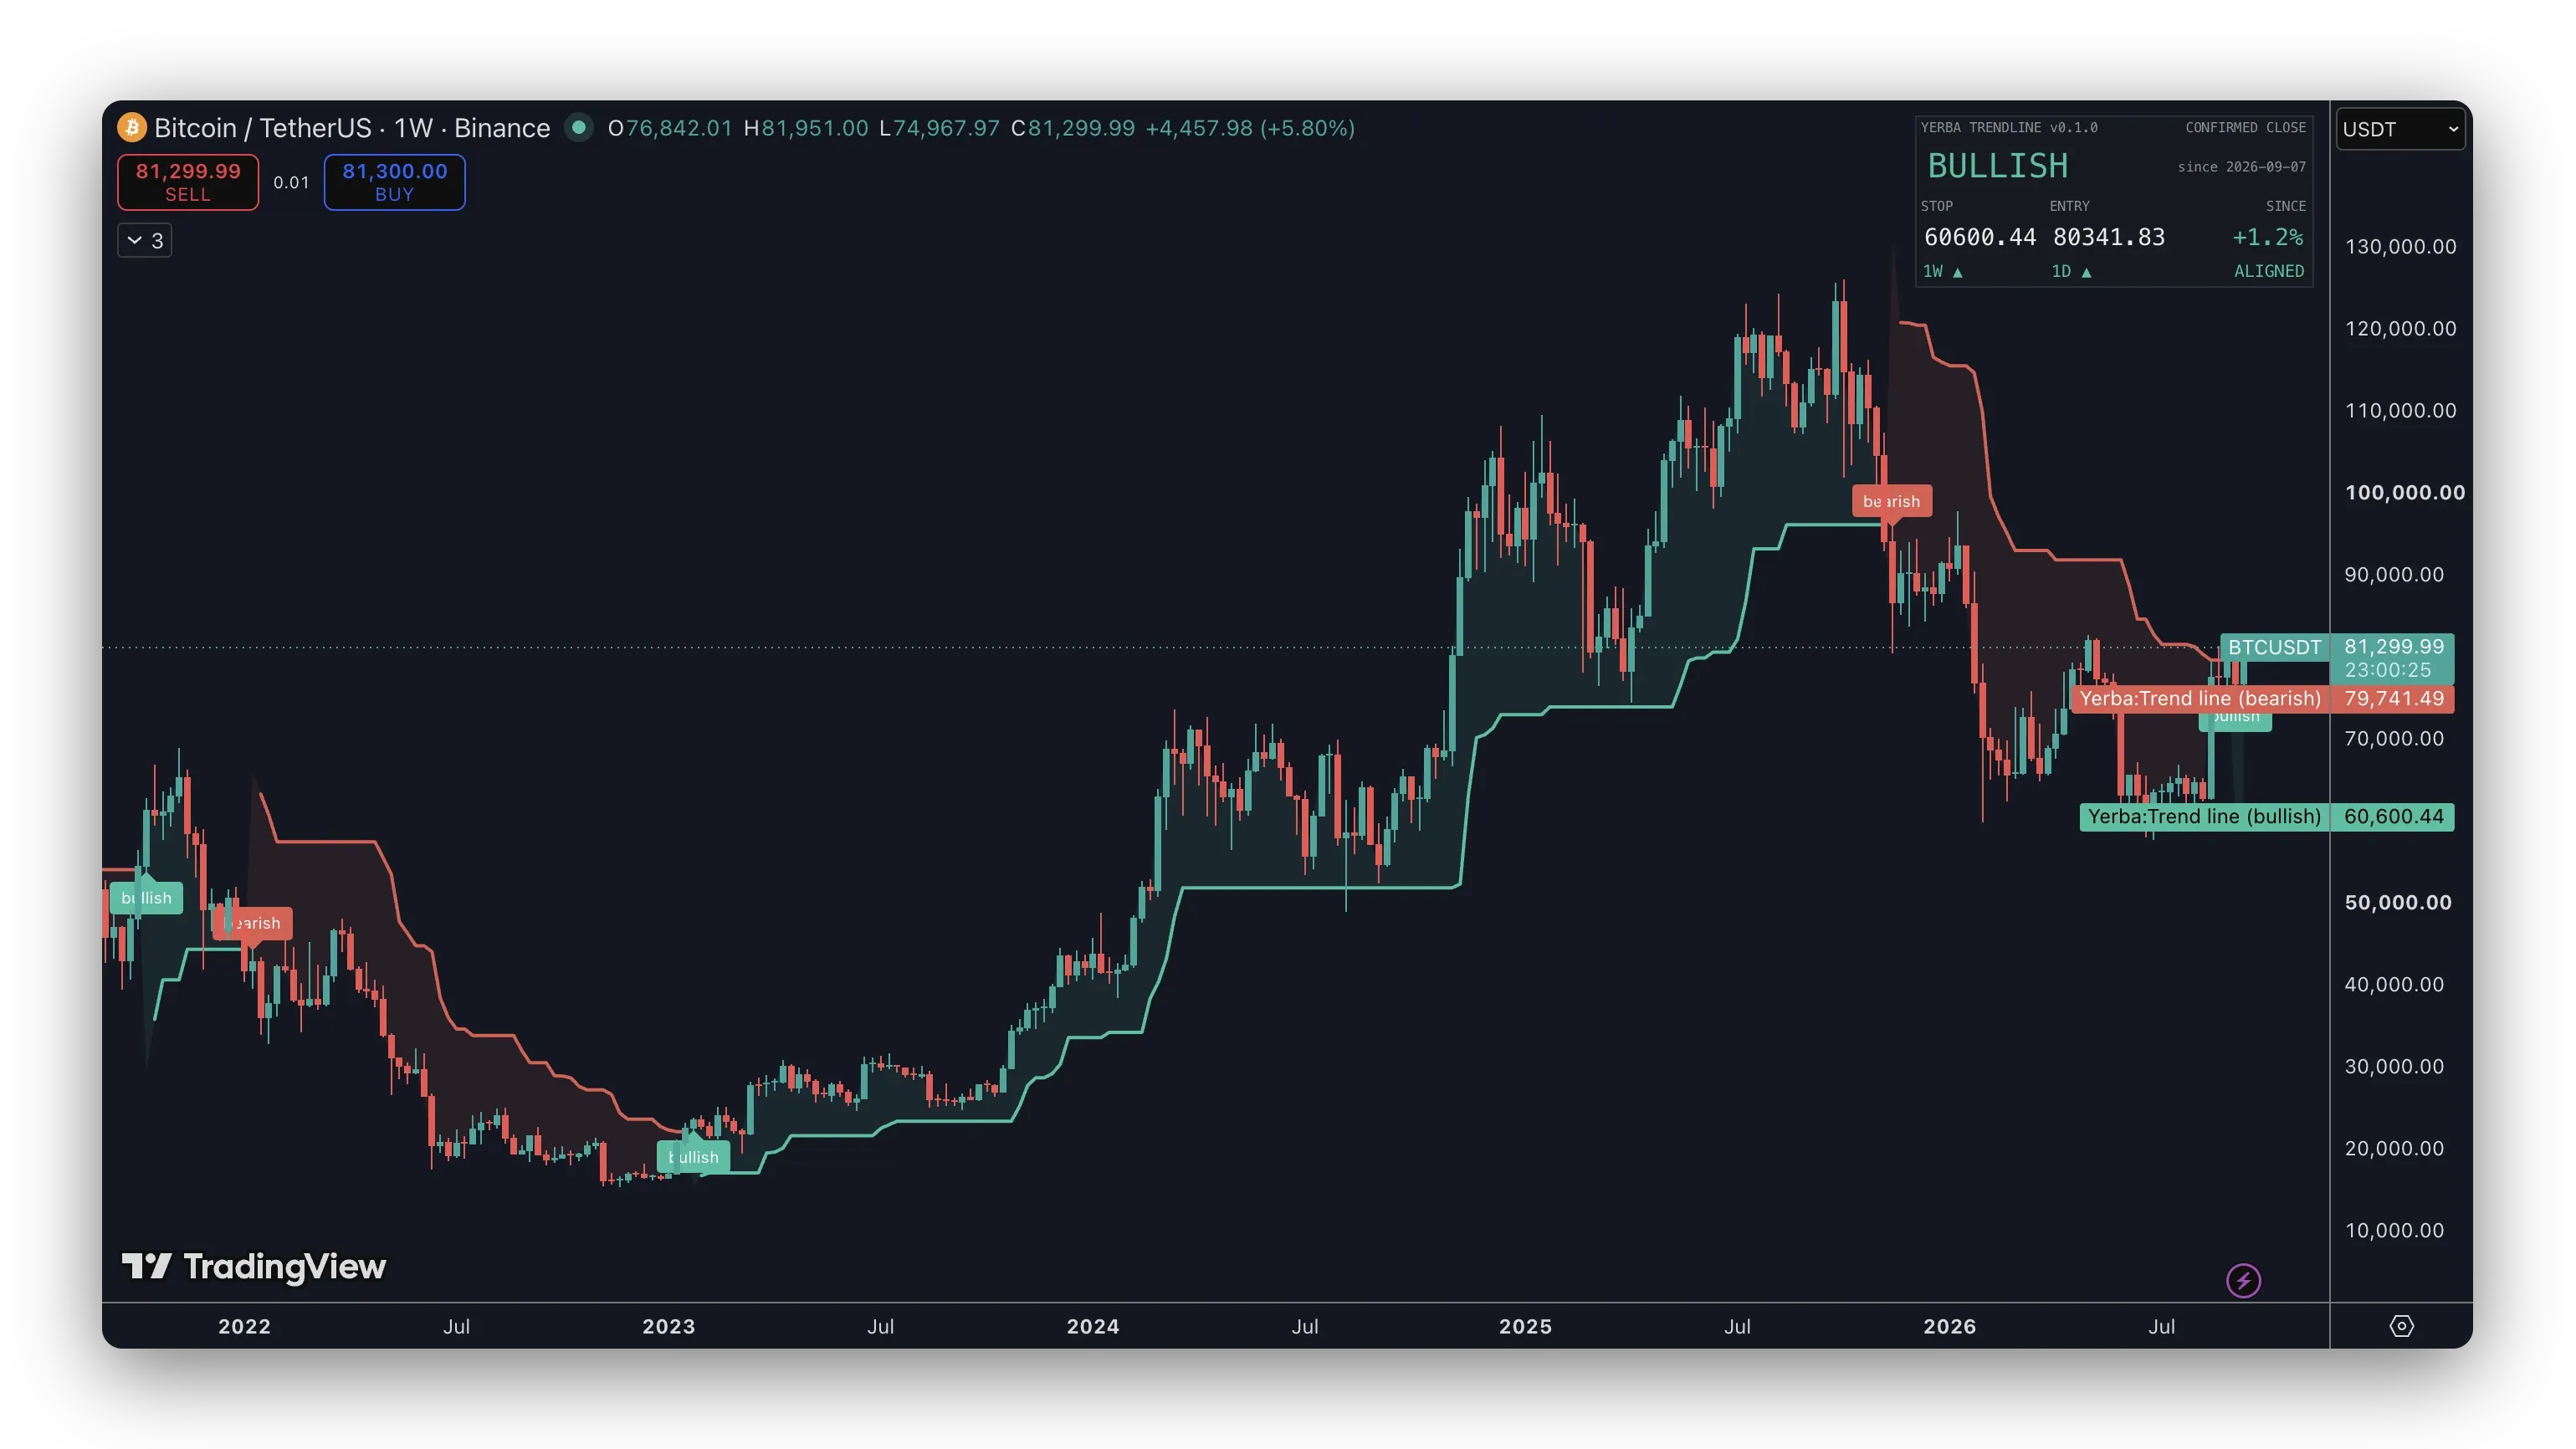
BTC at (10, 3.0), weekly, five years, captured 2026-09-19 with the shipped file. Four flips. The same bars at (10, 2.0) flip nine times. This is what the sweep was refusing to see: a wider band is not a worse fit, it is a different asset.
Path, not endpoints: mining the stream for hovered bars
Here’s the method that changed the project. The indicator’s on-chart table only ever describes the newest bar. So every screenshot I’d caught by hand was an endpoint: where the ratchet is now. After weeks of that, the history file had nine rows.
But when the cursor rests on an old bar, TradingView’s status line reports that bar’s level. A trailing stop is a path, and a frame where the streamer happens to be hovering history is a point on the path.
A live readout tells you where a ratchet is. A hovered historical bar tells you how it got there.
So the tool samples the stream’s frames and decides when to look from what the speaker is saying (the captions cue it, not a blind interval). It locates the table, the chart header and the status line by finding their labels rather than by a remembered crop, because the chart is laid out however his workspace was that day. Then it OCRs all three (optical character recognition: software reading the numbers out of the pixels) and pairs the status-line level with the header’s open, high, low and close. Nothing is appended automatically. The output is a review queue, because a misread digit corrupts the ground truth silently.
One rule makes the whole thing honest. The bar is identified by its own four prices, never by our engine’s nearest level, so no reading can agree with us by construction. Matching a level to whichever bar our engine puts it on would manufacture agreement. Matching four prices against the exchange’s series is an identity lookup on data the indicator has no say in.
The payoff, on September 12: ETH reproduces twelve hovered readings spanning April 2020 to April 2026, every one exact, and no other parameter pair reproduces a single one.
A note on the OCR, because it bit. Nine of 42 machine reads from one stream were wrong, and every single correction landed on the engine’s side. A spurious leading 9 turned 93.51 into 943.51. A dropped decimal turned a fraction into an eight-digit integer. OCR corrupts correct readings; it essentially never invents a reading that happens to match an engine it knows nothing about. Before verifying by eye: ETH 11 of 14, SOL 6 of 11. After: ETH 12 of 12, SOL 6 of 6. Nothing about the engine changed. Two levels were illegible behind the crosshair and were dropped rather than guessed.
TAKEAWAY: a score computed over unverified machine-read data is a floor, not a measurement.
The display lag
At bar k, the indicator shows the stop committed by the close of bar k-1. That’s the level that was in force while bar k traded, not the one bar k itself produced. Obvious in hindsight (a stop can’t know the bar it’s drawn on until that bar closes), and not cosmetic: scoring readings against the raw level instead of the lagged one made a correct port read 4.3% wrong on ETH.
The two numbers are SOL on September 12. The lab script prints both, and they land on the two values the lag predicts.
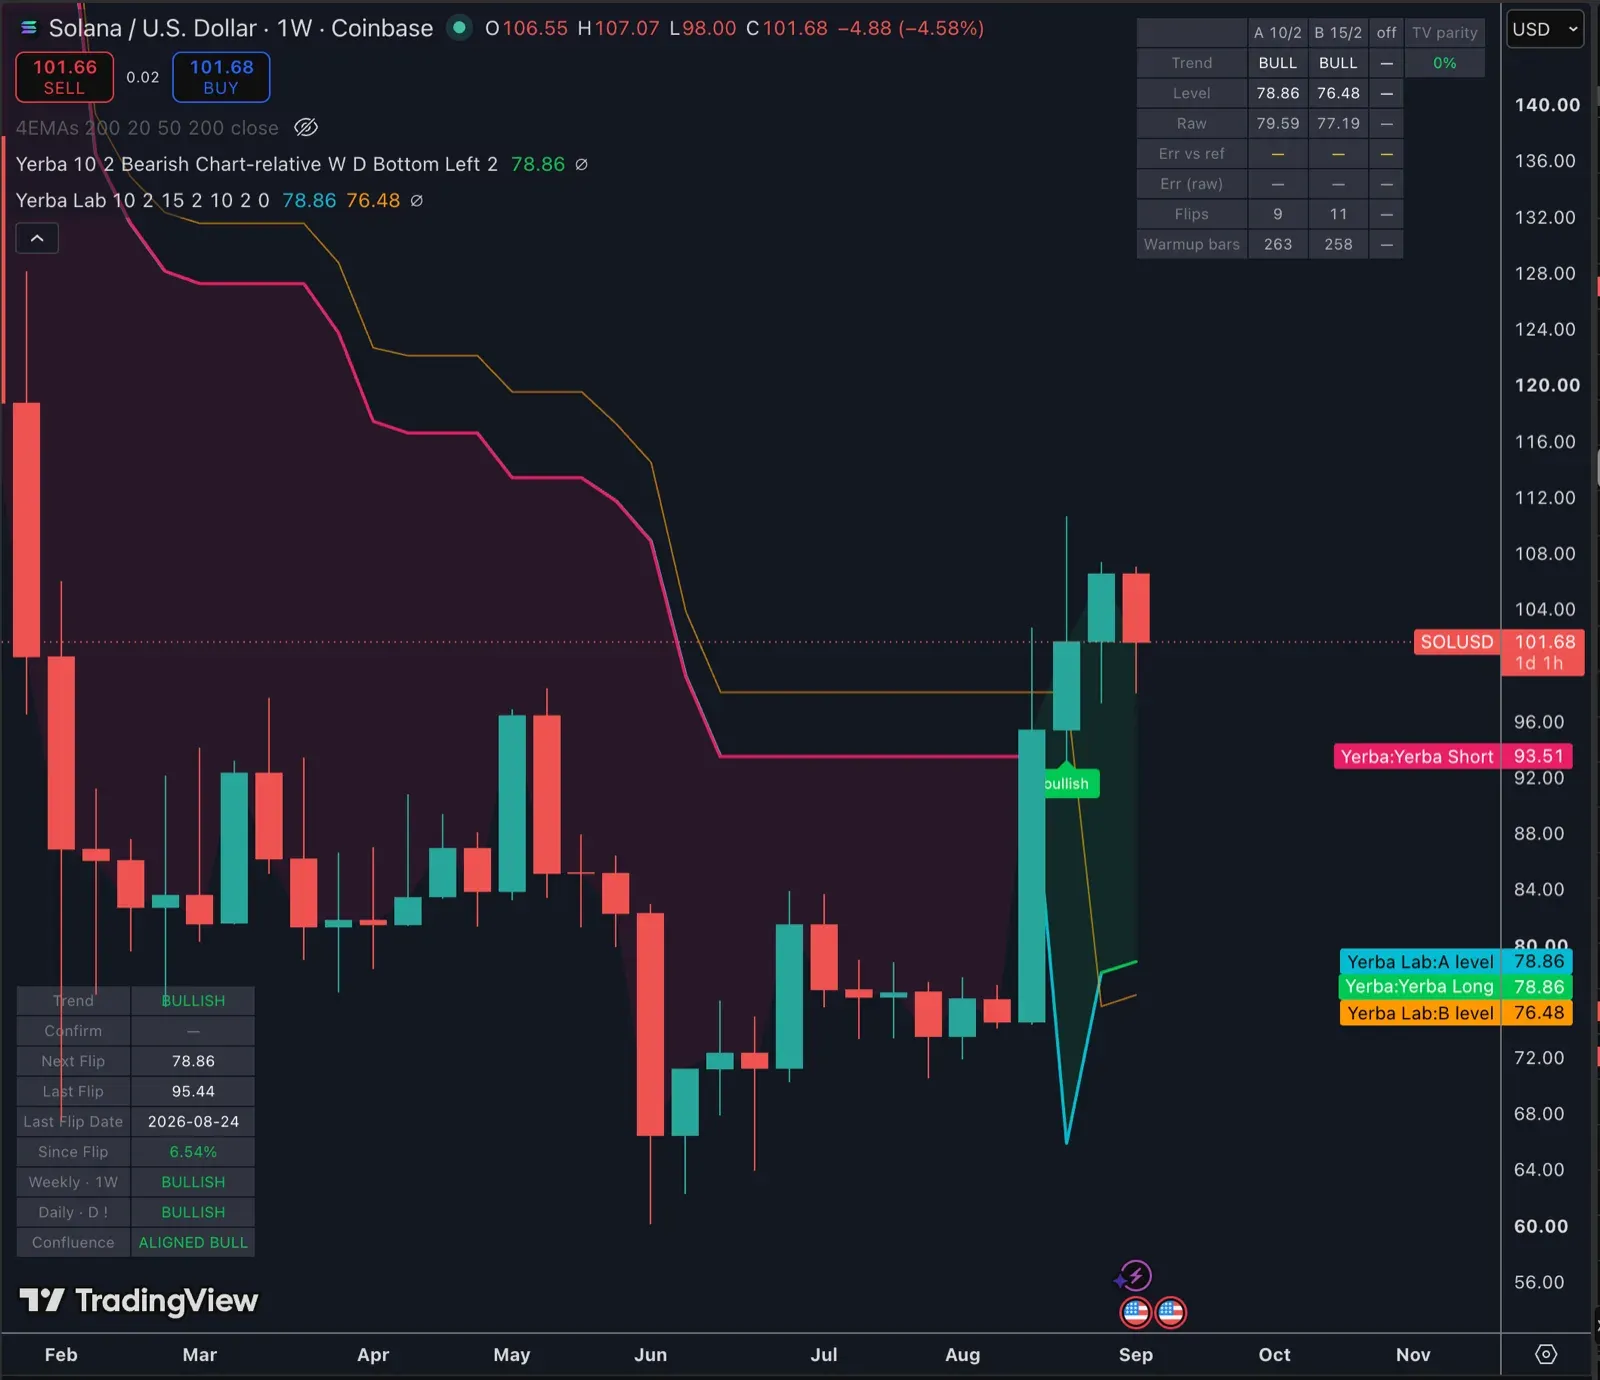
The actual chart, September 12. Level 78.86 and Raw 79.59 against Python’s 78.8608 and 79.5852. Two columns landing on two predicted values is a stronger test than either alone.
Closing the chain: Python, Pine, and TradingView’s own engine
There’s no Pine compiler on my machine, and no local one exists. Every Pine result came from me pasting a script into TradingView’s editor and reading numbers off a chart. For the first week that round trip was the scarce resource, so every sitting got a logged entry stamped with the exact version of the script being run, written before the findings went anywhere else. A conclusion with no run behind it is a number nobody can reproduce.
Then the reading half stopped needing me. A script drives the browser: navigates to a symbol, waits, screenshots, and the same OCR reads the chart. Seven charts on five exchanges in one pass, where each had been a separate sitting. A second script hovers a named historical bar and photographs the legend beside it. That one needed a real mouse-move event, not a cursor warp, because the chart redraws its legend from the event. A warp alone produces a perfectly plausible screenshot of the previous bar’s values.
The arithmetic is never the evidence. Bar spacing was measured at 22 logical points per week, so the target bar is a subtraction. Every capture still photographs the crosshair’s own date label, because “the arithmetic said x=934” is precisely the shape of every wrong number in this post.
With reading cheap, the last link closed. A lab script runs our engine beside TradingView’s built-in SuperTrend and prints the difference.
Until this read, every calibration number rested on a Python engine that had never been checked against a reference implementation. The two could have been wrong together.
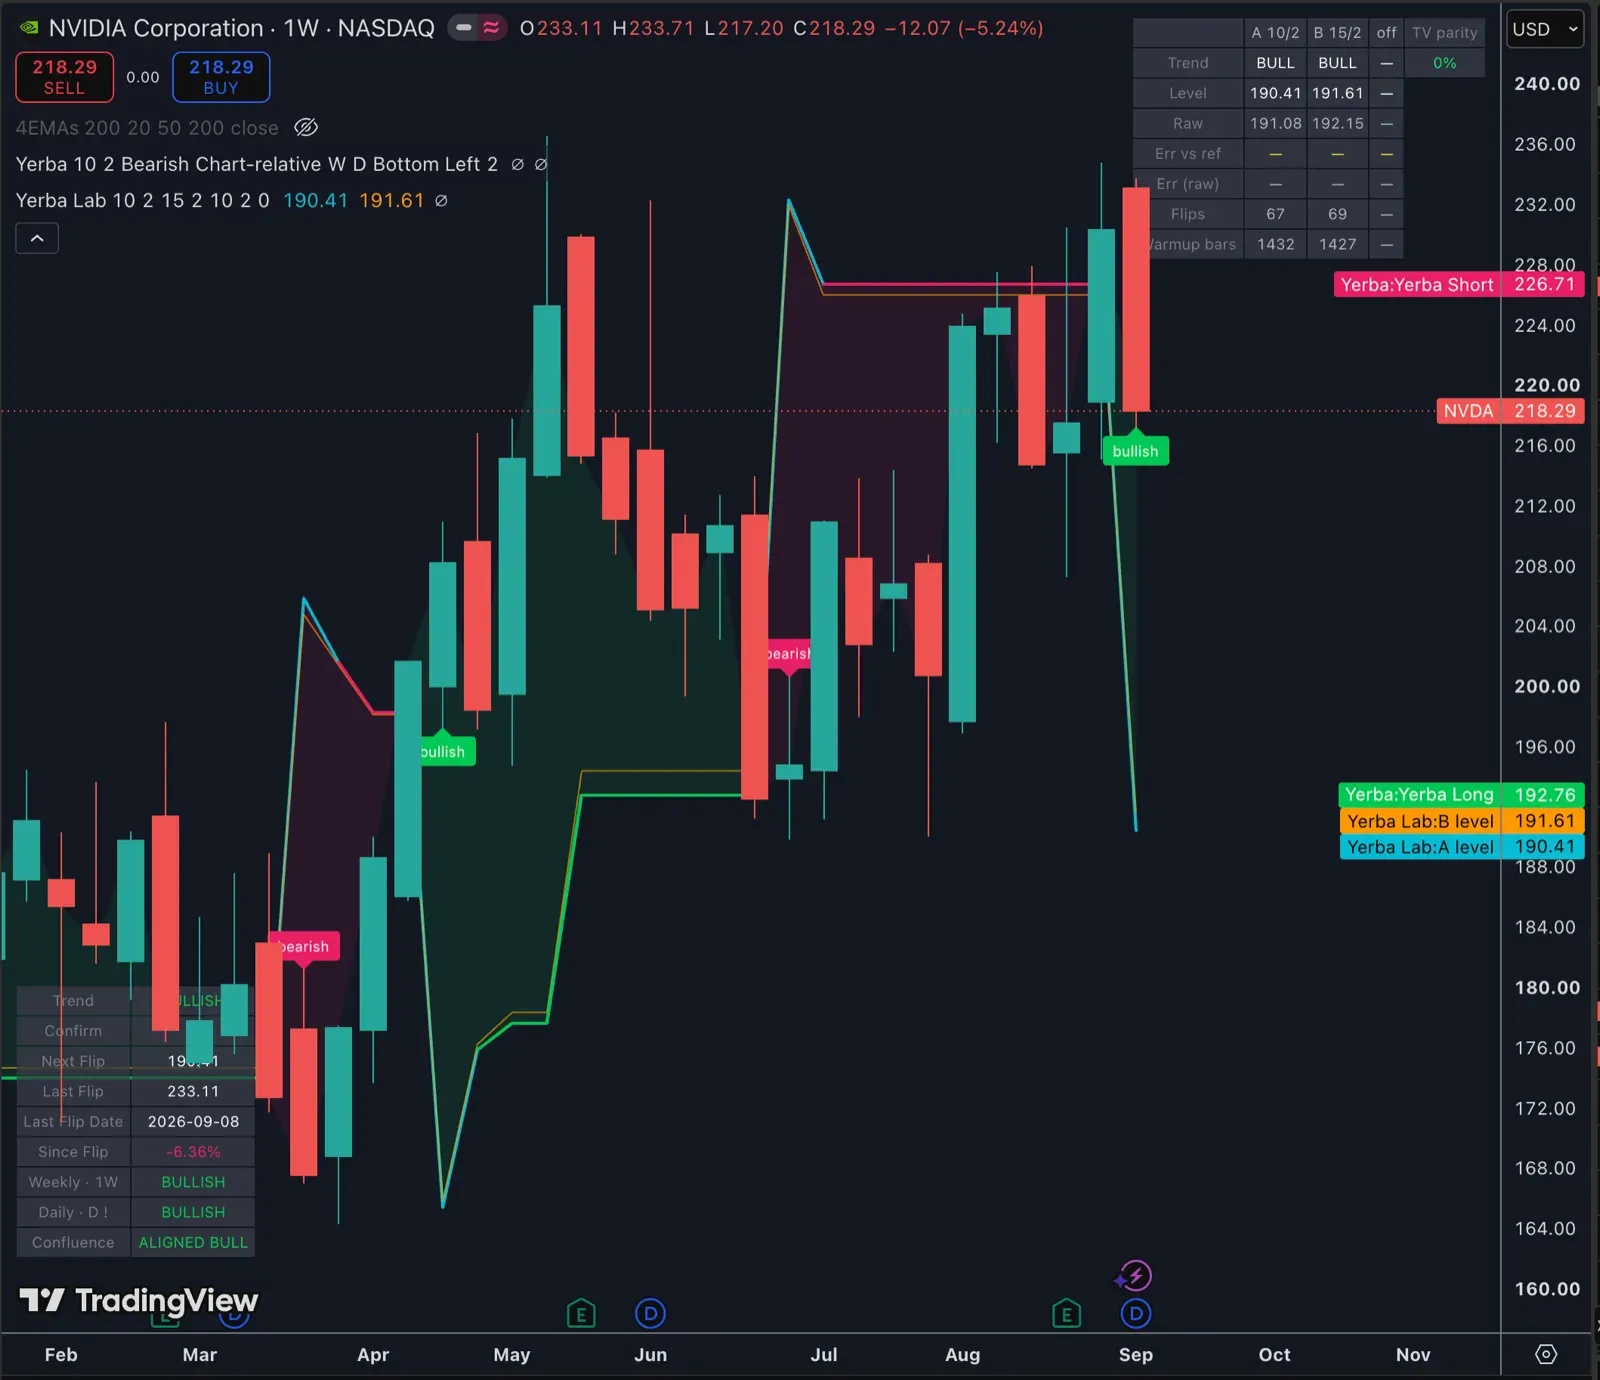
Yerba on an equity, same day. Equities are where the entry convention could be tested at all: on a holiday week the signal bar’s close and the labelled bar’s open differ by 3.63%, and the indicator books the open. On crypto the two numbers are identical and the question can’t be asked.
Scored at each asset’s own parameters, against the feed its chart was actually on:
| result | |
|---|---|
| Flip date exact | 52 of 55 (95%) |
| Entry price | median 0.04% |
| Level, live readings | median 0.00%, 36 of 38 inside 0.5% |
| Level, 37 hovered historical readings | 36 exact, worst 0.067% |
Against a substituted exchange the same readings land at 0.211% median. The residual is the price series, not the engine. Given the same bars and the right two parameters, the reconstruction returns the reference’s number to the cent.
How I worked with the machine
This didn’t appear out of thin air. I had the idea, I designed the loop before any code existed, and I prompted every day for two weeks: 110 commits over ten working days. Week one built the reconstruction and the apparatus to measure it. Week two spent almost all of its effort proving week one wasn’t fooling itself, which is the honest ratio for this kind of work and not the one I expected.
My side of it: watching every stream and catching the screenshots. Writing the operating contract the model reads at the start of every session, which is where the naming rule, the frontmatter schema and the “log the run before you write it up” rule live. Pasting every Pine version into TradingView, the one thing it couldn’t do. And the calls: which hypothesis to chase, when a “structural” conclusion smelled wrong, when to stop sweeping and go read the frames.
Its side: six exchange APIs, the parameter sweep, the frame miner, the browser driver, and all the arithmetic. It also wrote the story as it went, because I made that a rule: a session isn’t finished when the code is, it’s finished when what the session taught is written down. Reconstructed from a diff afterwards, you get a tidy account of a session that didn’t happen.
Where it went wrong, it went wrong confidently. The “structural” conclusion. The 1,466-pair sweep that answered a question nobody needed answered. And the records: on day fourteen the README still said the Pine scripts had never been compiled, eight days after they had. The operating contract still called a chart round trip “the scarce resource” after reading had become cheap and pasting was the only human step left. A constraint lifted, and every piece of advice that followed from it kept sounding sensible while pointing the wrong way.
The model runs the sweep. Deciding what the sweep is asking is still my job.
From the bench to the shelf
A product page asks questions a repo never does, and it asked three in one evening. Where does the buyer pay. What does the buyer see. What is the file called. Every answer moved a decision.
The selling plan was written around invite-only publishing, the way indicators are usually sold on TradingView, and only then checked against the one line that decides it: invite-only scripts publish from a Premium account, and this chart runs on a free one. The plan was rewritten in an hour around selling the file itself. So the next morning I read the stores’ rules before naming the store. The first candidate’s prohibited list names “crypto products” and “signals” outright. The second onboards through a payment processor that doesn’t serve Argentina. The third has nothing on trading or software in its list at all and pays each sale straight into PayPal. Reading three prohibited lists took an hour and ruled out the two I’d assumed.
TAKEAWAY: the line that decides a plan on someone else’s platform is one sentence in their terms, and it gets read last because it’s boring. Read it first.
The panel went the same way. The nine-row table copies the reference’s layout because that’s how a capture becomes a row of ground truth, and a tool built to measure something ends up looking like the thing it measures. So the shipped file is its own file now. Same engine as the repo’s, verified by a diff that strips the comments and compares the two functions, but with a three-column card instead of the table and a header written for a buyer. One thing the product wanted and didn’t get: the repo keeps length and multiplier as inputs, because encoding the split would freeze an open finding, and a buyer would rather the chart picked the pair. The model wrote that, it failed to compile on the first paste, and the rule I’d set beforehand was that it ships only if it needs no round trip from me. So 0.1 ships the two inputs and the table, and the auto-pick is the first line of 0.2. Two audiences, two right answers, one function. Five days on, one file: the repo’s copy turned out to have no reader, since ground truth is harvested from the reference’s frames and never from our own table, and two copies of one engine drift. The shipped file is the calibration instrument now, and the nine-row table lives in git history.
The name changed shape too. The working name for the product echoed the reference’s, and I didn’t see it until the model flagged the shape. A grep catches a string. It doesn’t catch a rhyme. It ships as Yerba Trendline.
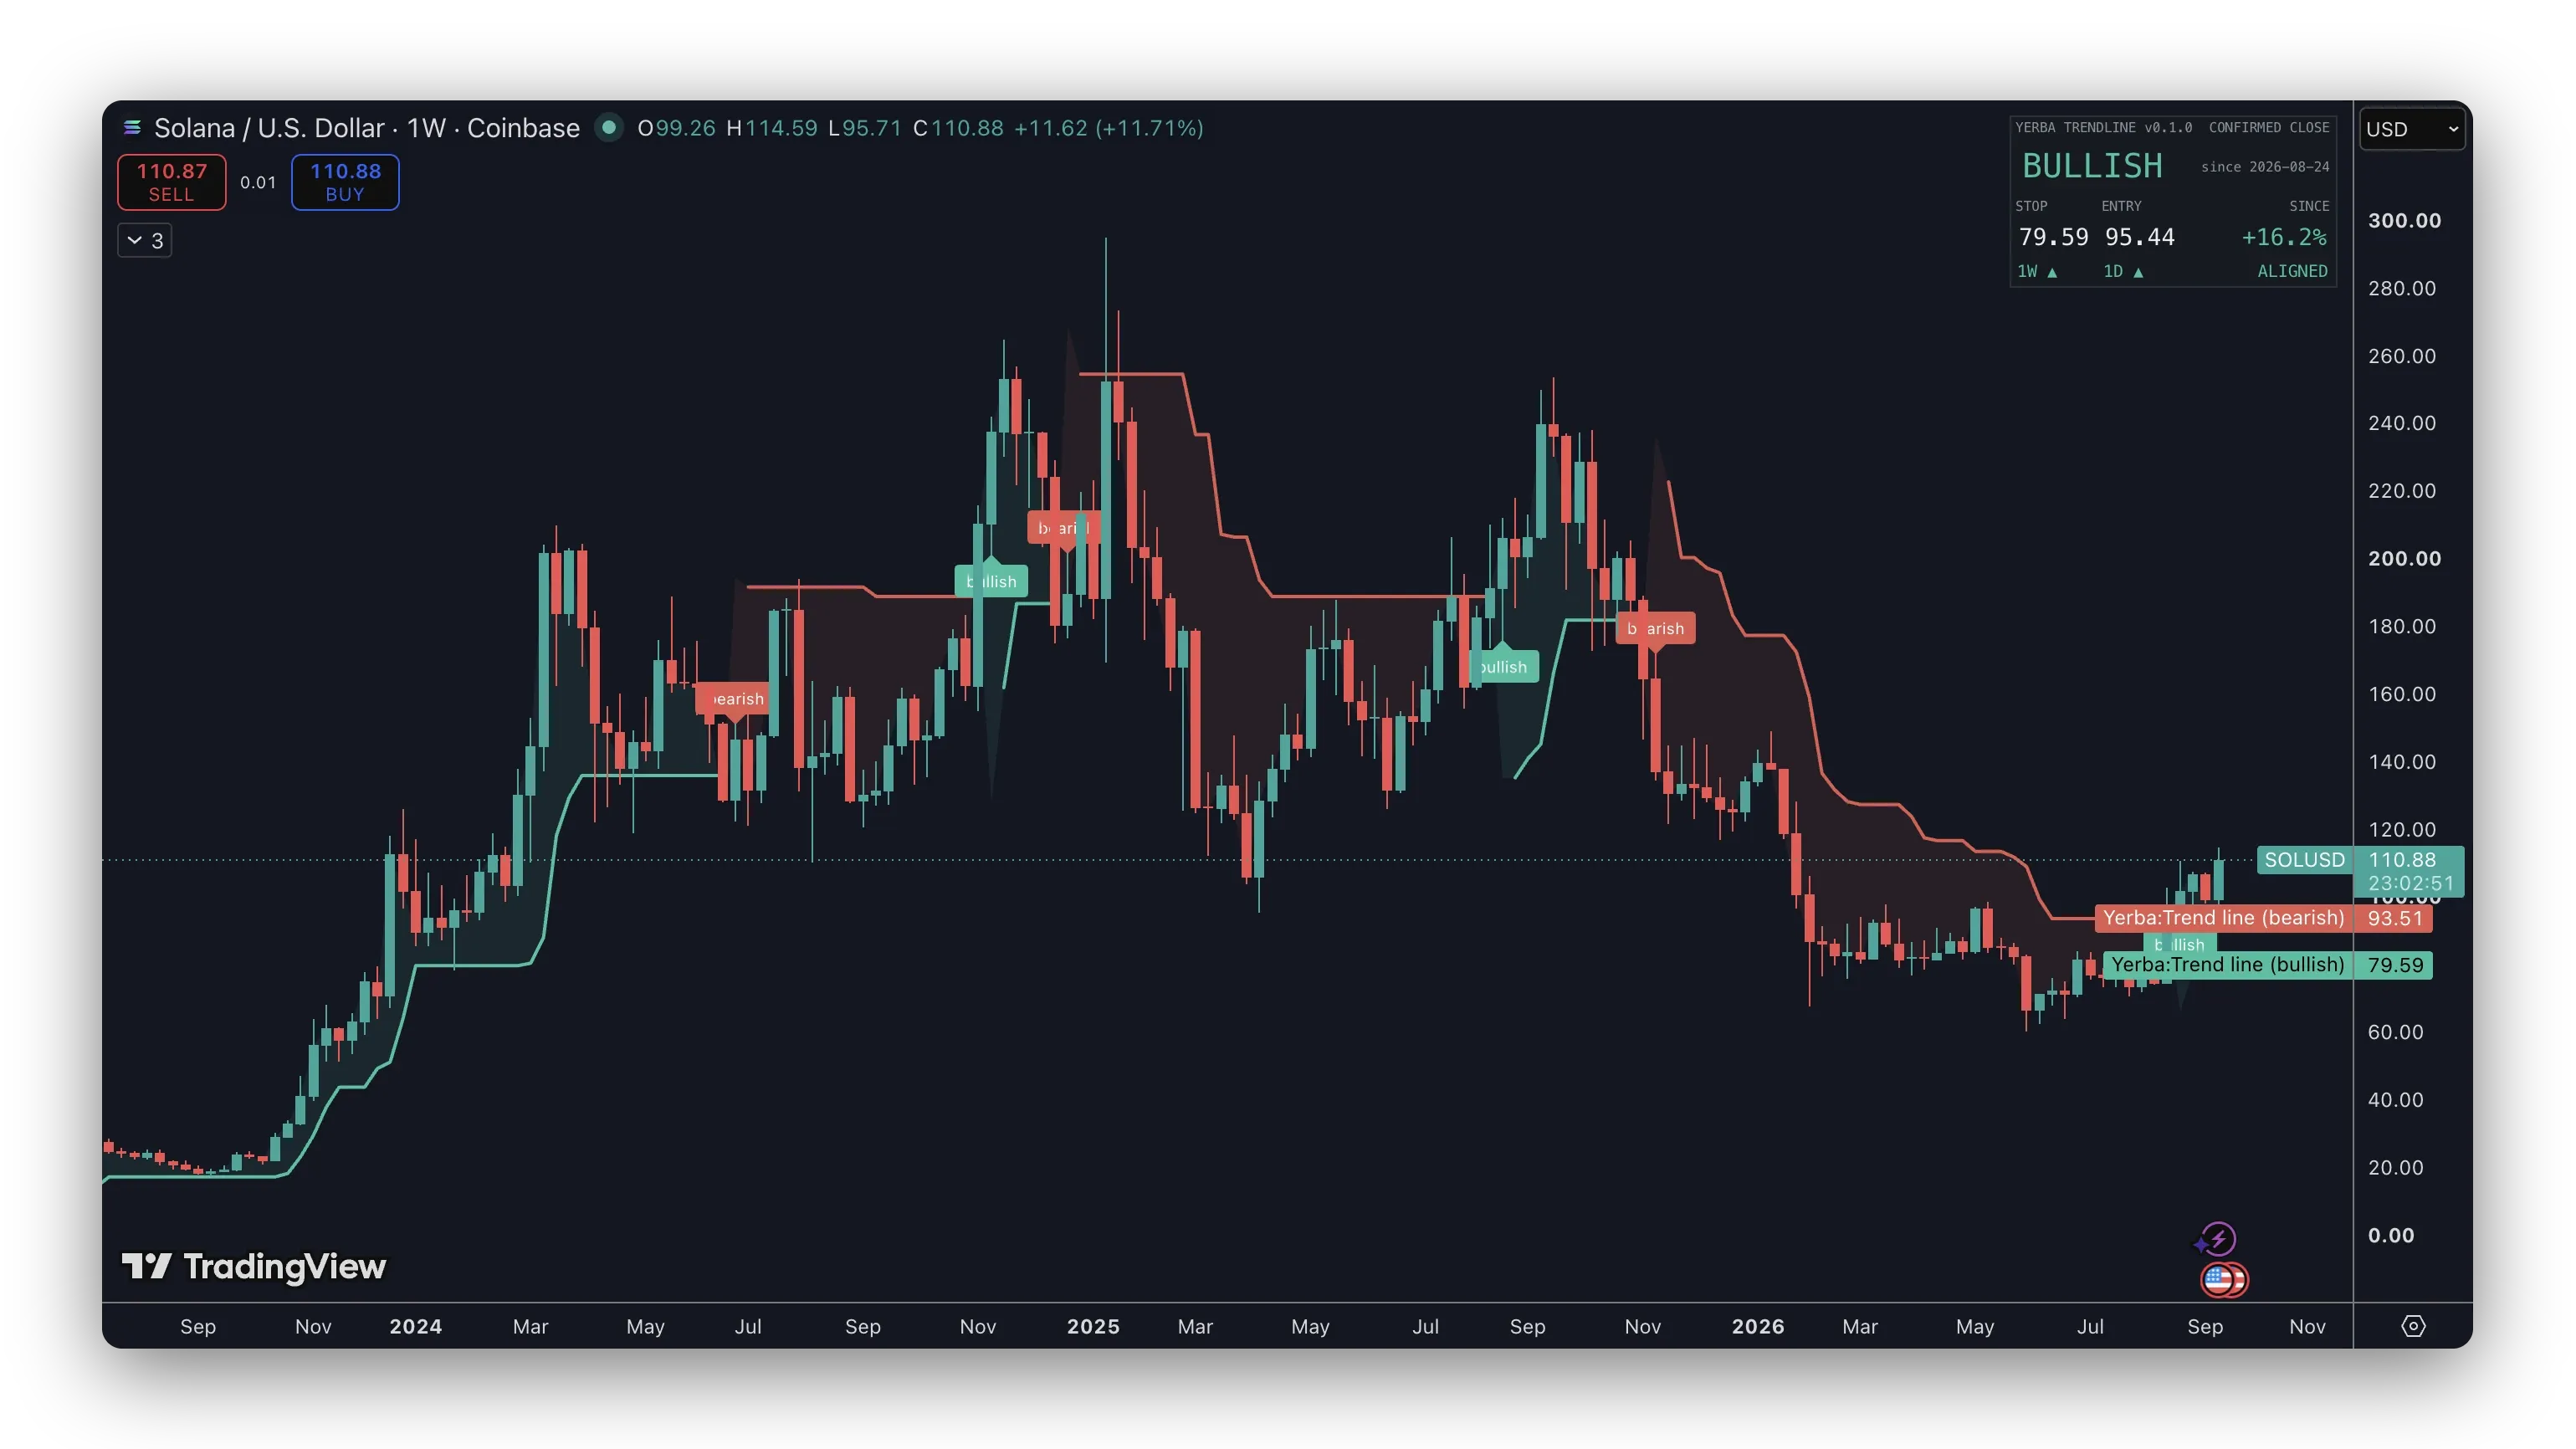
The shipped file on a live chart, 2026-09-19: SOL weekly, the card instead of the table. Same engine as the September 12 capture above, same 79.59, one week later and dressed for a buyer. The legend reads “Yerba” and nothing else, which took a third paste: TradingView prints every input after an indicator’s name unless each one opts out.
The decisions, on the record
| DEC | Decision | Status |
|---|---|---|
| DEC 001 | Ground truth comes only from what the reference displays in public. Nothing decompiled, nothing redistributed | SETTLED |
| DEC 002 | The reference is never named in code, commits or prose. A grep enforces it | SETTLED |
| DEC 003 | One ingest pass serves both the trading rules and the port | SETTLED |
| DEC 004 | Observations overrule labels. The visible 5 and 3 were rejected on the flip dates | SETTLED |
| DEC 005 | Bars are identified by their own prices, never by the engine’s nearest level | SETTLED |
| DEC 006 | Length and multiplier stay as inputs, not a per-ticker table. Encoding the split would freeze an open finding. The product picks the pair by symbol in 0.2; 0.1 ships the inputs and the table | TESTING |
| DEC 007 | Every chart sitting is logged with the script’s version before findings go anywhere | SETTLED |
| DEC 008 | Markdown is the source of truth. The SQLite index is generated, disposable, never hand-edited | SETTLED |
| DEC 009 | The story is a deliverable. A session ends when what it taught is written | SETTLED |
| DEC 010 | Redesign the on-chart panel before anything ships. Written into the shipped file, not compiled yet | TESTING |
| DEC 011 | Sell the .pine file, not invite-only access. Invite-only needs a Premium plan; the chart runs on a free one | SETTLED |
| DEC 012 | The shipped file is its own deliverable. Same engine as the repo’s, proved by diff; its own header and card | SETTLED |
| DEC 013 | Choose the store by its prohibited list, read in full, before anything else about it | SETTLED |
| DEC 014 | All sales final, with one exception: the file won’t compile in a current Pine editor and can’t be fixed within 14 days | SETTLED |
| DEC 015 | The product’s name must not echo the reference’s shape, not only its string. It ships as Yerba Trendline | SETTLED |
What’s still open
Why the parameters vary at all. Three assets fit no pair yet: MORPHO’s best fit is off by 2.59% and it’s neither the OCR nor the warm-up. ADA’s flip date lands three weeks off every candidate. ASTER reports a flat level across five months that no ratchet produces. BNB is solved in shape and blocked on a series I can’t fetch. And the single most informative line ever captured about how the indicator is built arrived as a throwaway aside in a Q&A, which is how rare that kind of evidence is.
One honest note on the visuals. The nine-row table the repo’s Yerba draws copies the reference’s layout row for row, because reading one off a capture is how a frame becomes a row of ground truth. That was the right call for calibration and the wrong one for anything that ships, which is why the shipped file draws a card instead. The header image of this post is a mockup of that card: the state, the two prices that matter, and the confluence strip. The chart under it is real (KuCoin’s HYPE weekly bars through the same engine at HYPE’s own parameters, and the 51.14 entry is the one in the ground-truth file), but the panel is drawn, not a screenshot. The real one hasn’t been compiled yet. A capture replaces the drawing when it has.
Yerba Trendline has a product page, and a package waiting on one paste into a Pine editor. Follow-up backtests will be posted as I gather more data. The trading rules the source material came with, sixteen of them so far, two already measured and one already contradicted, are the next entry. None of this is investment advice; it’s a reconstruction on the bench, and it leaves the bench when the shipped file has run on live charts, not before.