Deadlink Labs / Products
Yerba Trendline
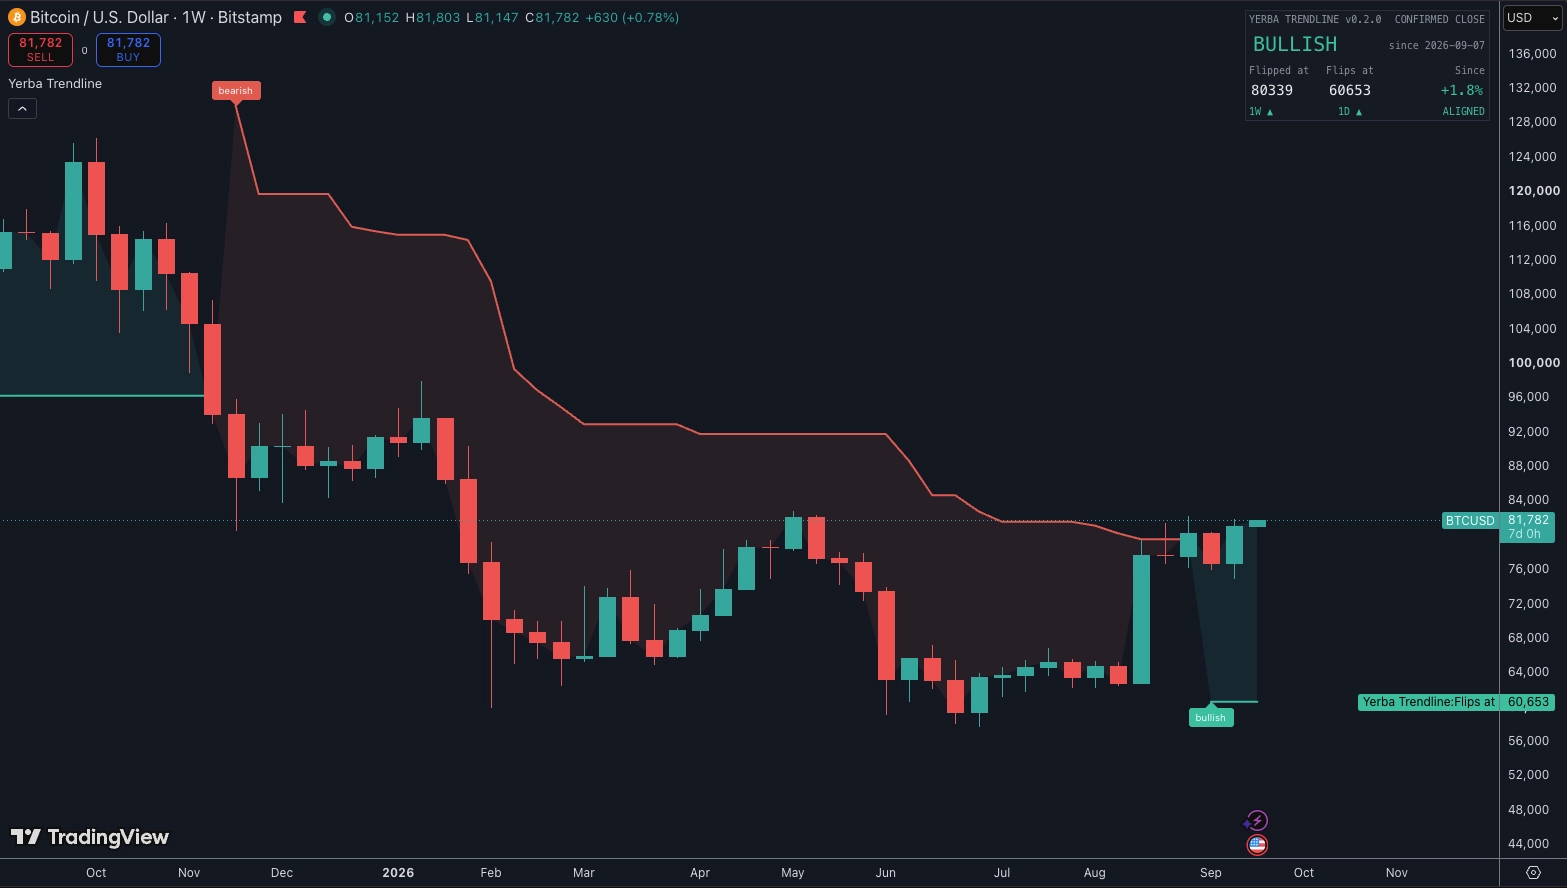
You know the feeling. A coin you hold drops 15% in a week and you can’t tell whether that’s a dip inside an uptrend or the start of the next leg down. So you check three indicators, a Telegram group and your gut, and they disagree.
Yerba Trendline answers one question, on the weekly chart, and it doesn’t change its mind mid-week: which side of the trend are you on, and at what price does that stop being true.
What it puts on your chart
A single line under price in an uptrend, above it in a downtrend. The line only ever moves in the direction of the trend, and it only moves on a confirmed weekly close, so it can’t be shaken out by a Tuesday wick. When a week closes through it, the trend flips and the line jumps to the other side.
In the corner of the chart, one card:
- The state. Bullish or bearish, and since when.
- Flipped at. The price where this trend started, and how far price has moved since.
- Flips at. The price that, closed through, ends it. That’s your exit, decided in advance.
- Confluence. Whether the daily chart agrees with the weekly. Aligned, or in conflict.
The two prices read left to right in time: where this trend began, where it ends.
Three alerts: flip to bullish, flip to bearish, any flip. That’s it. No oscillator, no cloud, no seven-color histogram. The chart itself runs on a free TradingView account; alerts on any indicator need their Essential plan or higher, which is TradingView’s rule, not mine.
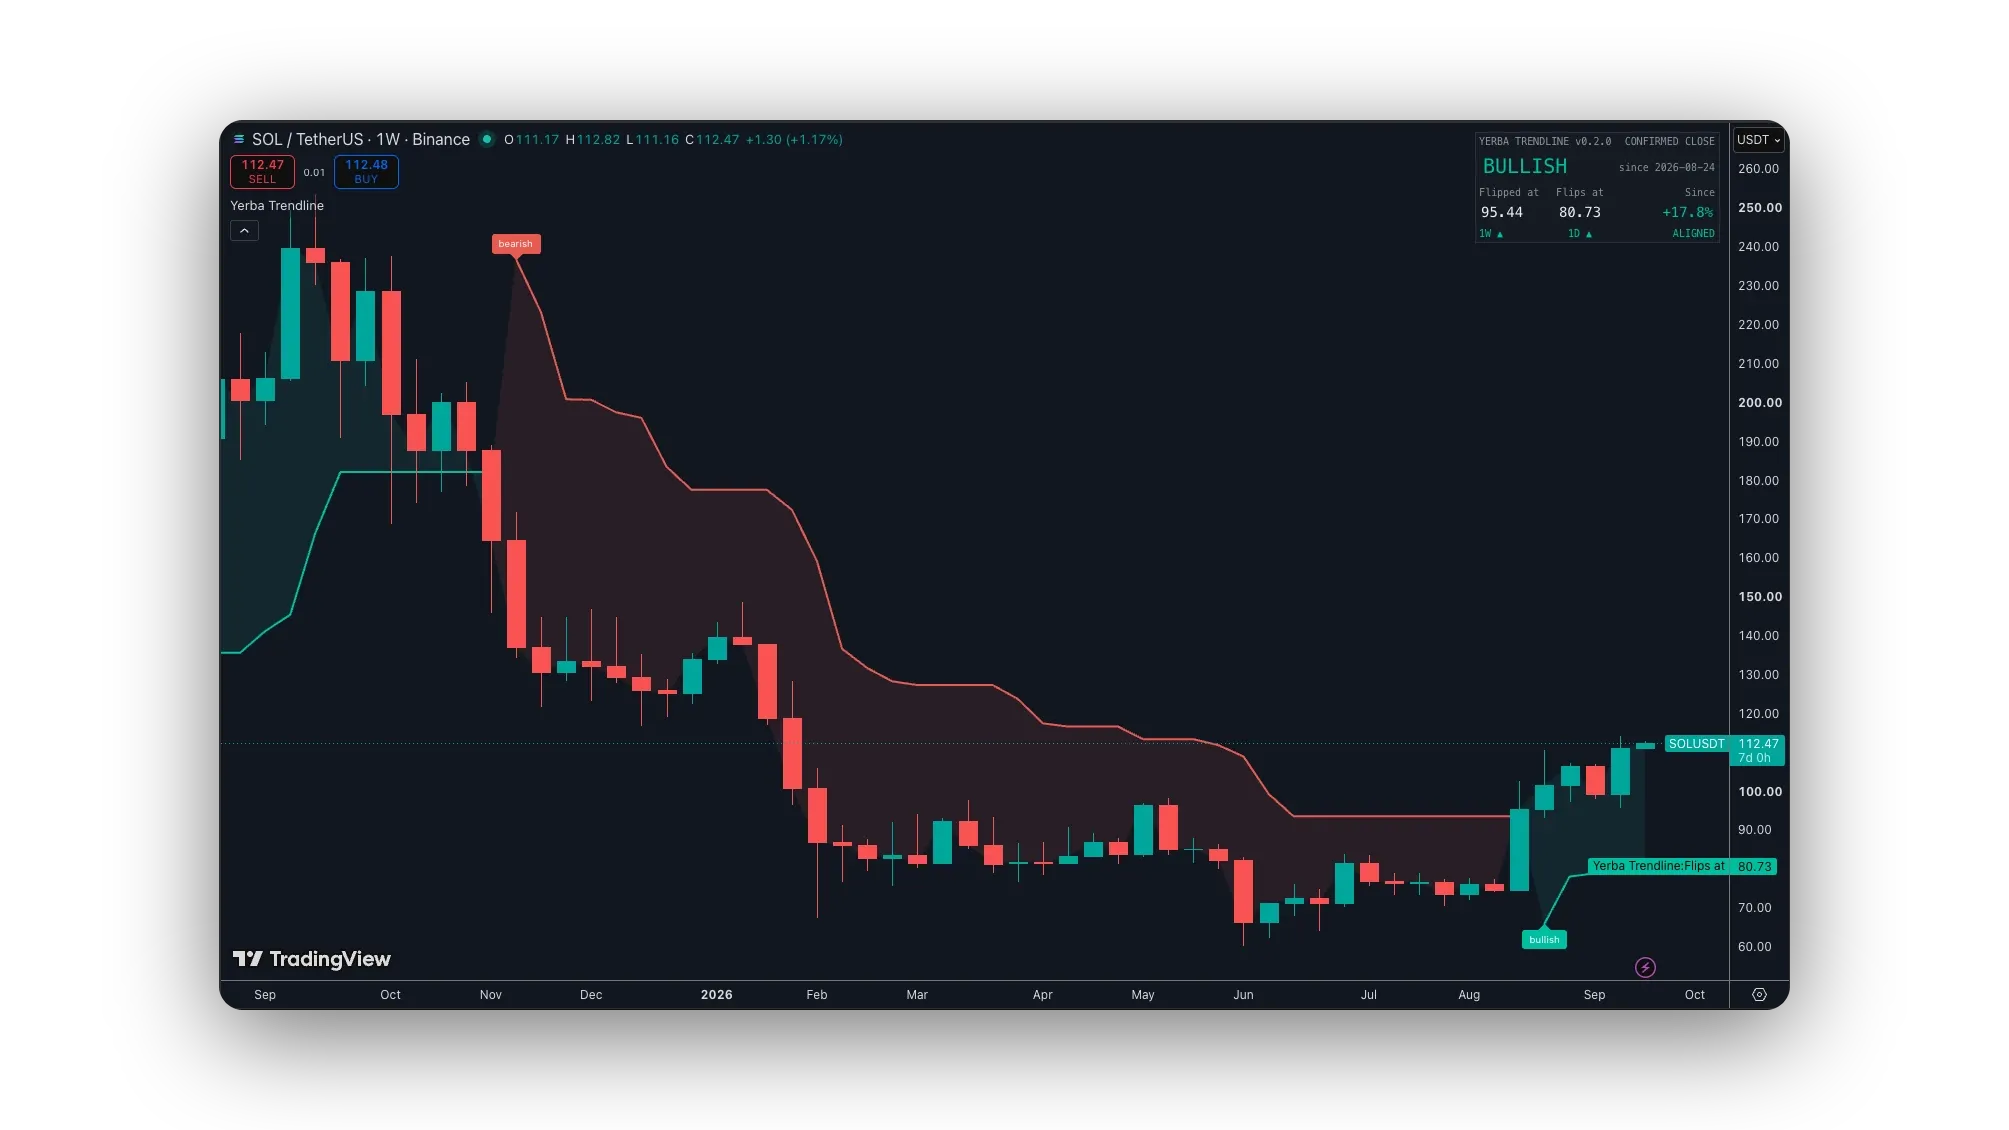
Solana, weekly, captured 2026-09-20. Every flip labelled where the week closed through the line; the card in the corner is the state that day. What it draws, not what it would have made.
Why the parameters are per asset
Most trend lines ship with one setting for every chart. Yerba doesn’t, because the market doesn’t. Two weeks of measuring showed that the right band width and lookback differ by asset: one pair fits SOL, ETH and XRP, another fits twenty-three others, and BTC wants a third. The per-asset table is the product; the formula underneath is textbook. 28 assets are classified today, crypto and stocks, and the table grows with every update.
You don’t set any of it. The indicator reads the symbol on the chart and applies that asset’s two numbers by itself — switch from BTC to ETH and the pair follows. The table still ships, so you can look a pair up or see what’s classified, and you can switch the automatic setting off and type the numbers yourself on any chart.
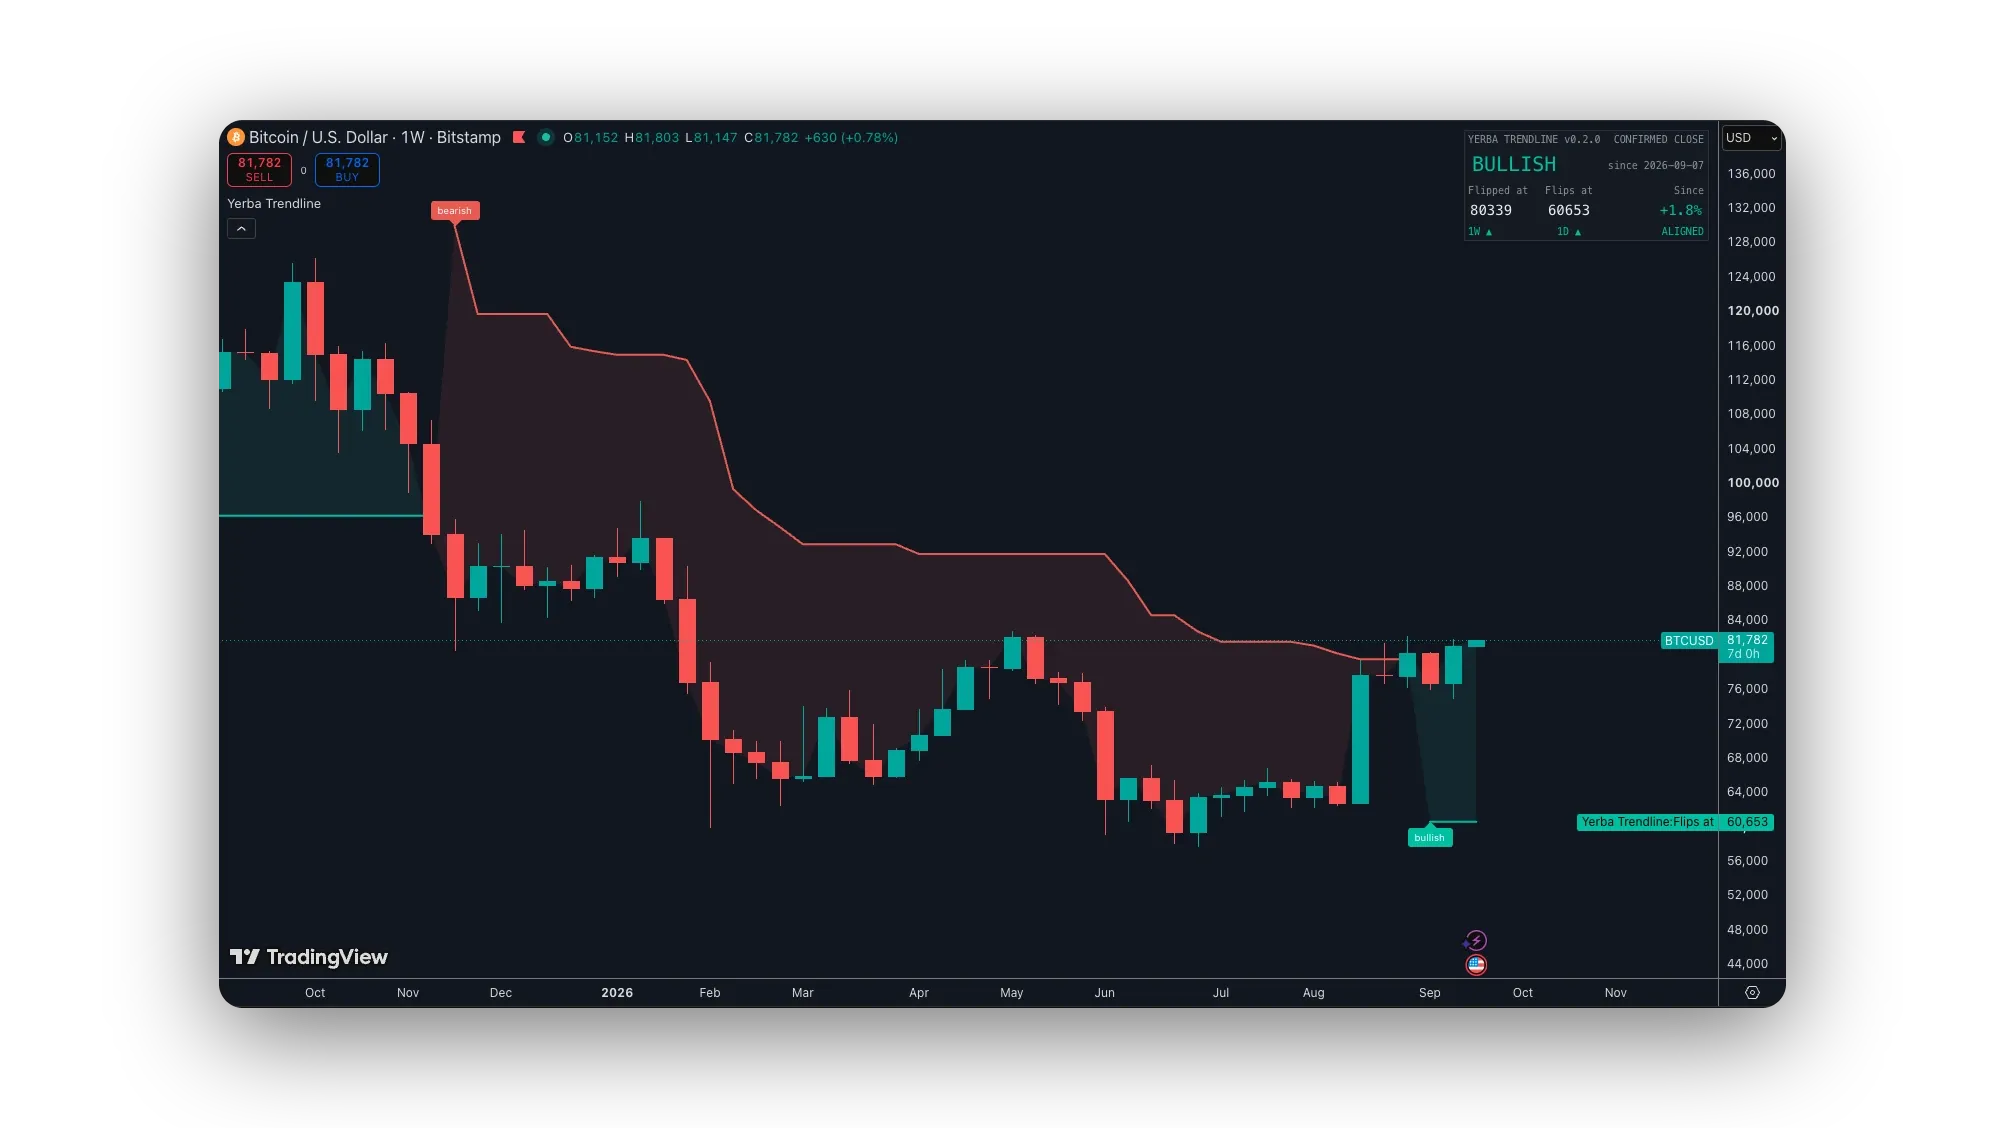
Bitcoin at its own pair, weekly, captured 2026-09-20. Nothing was typed to get this: the chart says BTC, so the indicator used BTC’s pair. At the pair that fits Solana it flips more than twice as often over the same bars. That difference is the table.
When the daily and the weekly disagree
Most of the time both timeframes point the same way and the card says ALIGNED, which is the boring case and the one you want. The interesting case is the other one. A daily chart turning up inside a weekly downtrend is the single most expensive disagreement in trading, because it looks exactly like the bottom. The card calls it CONFLICT and leaves the weekly trend where it is.
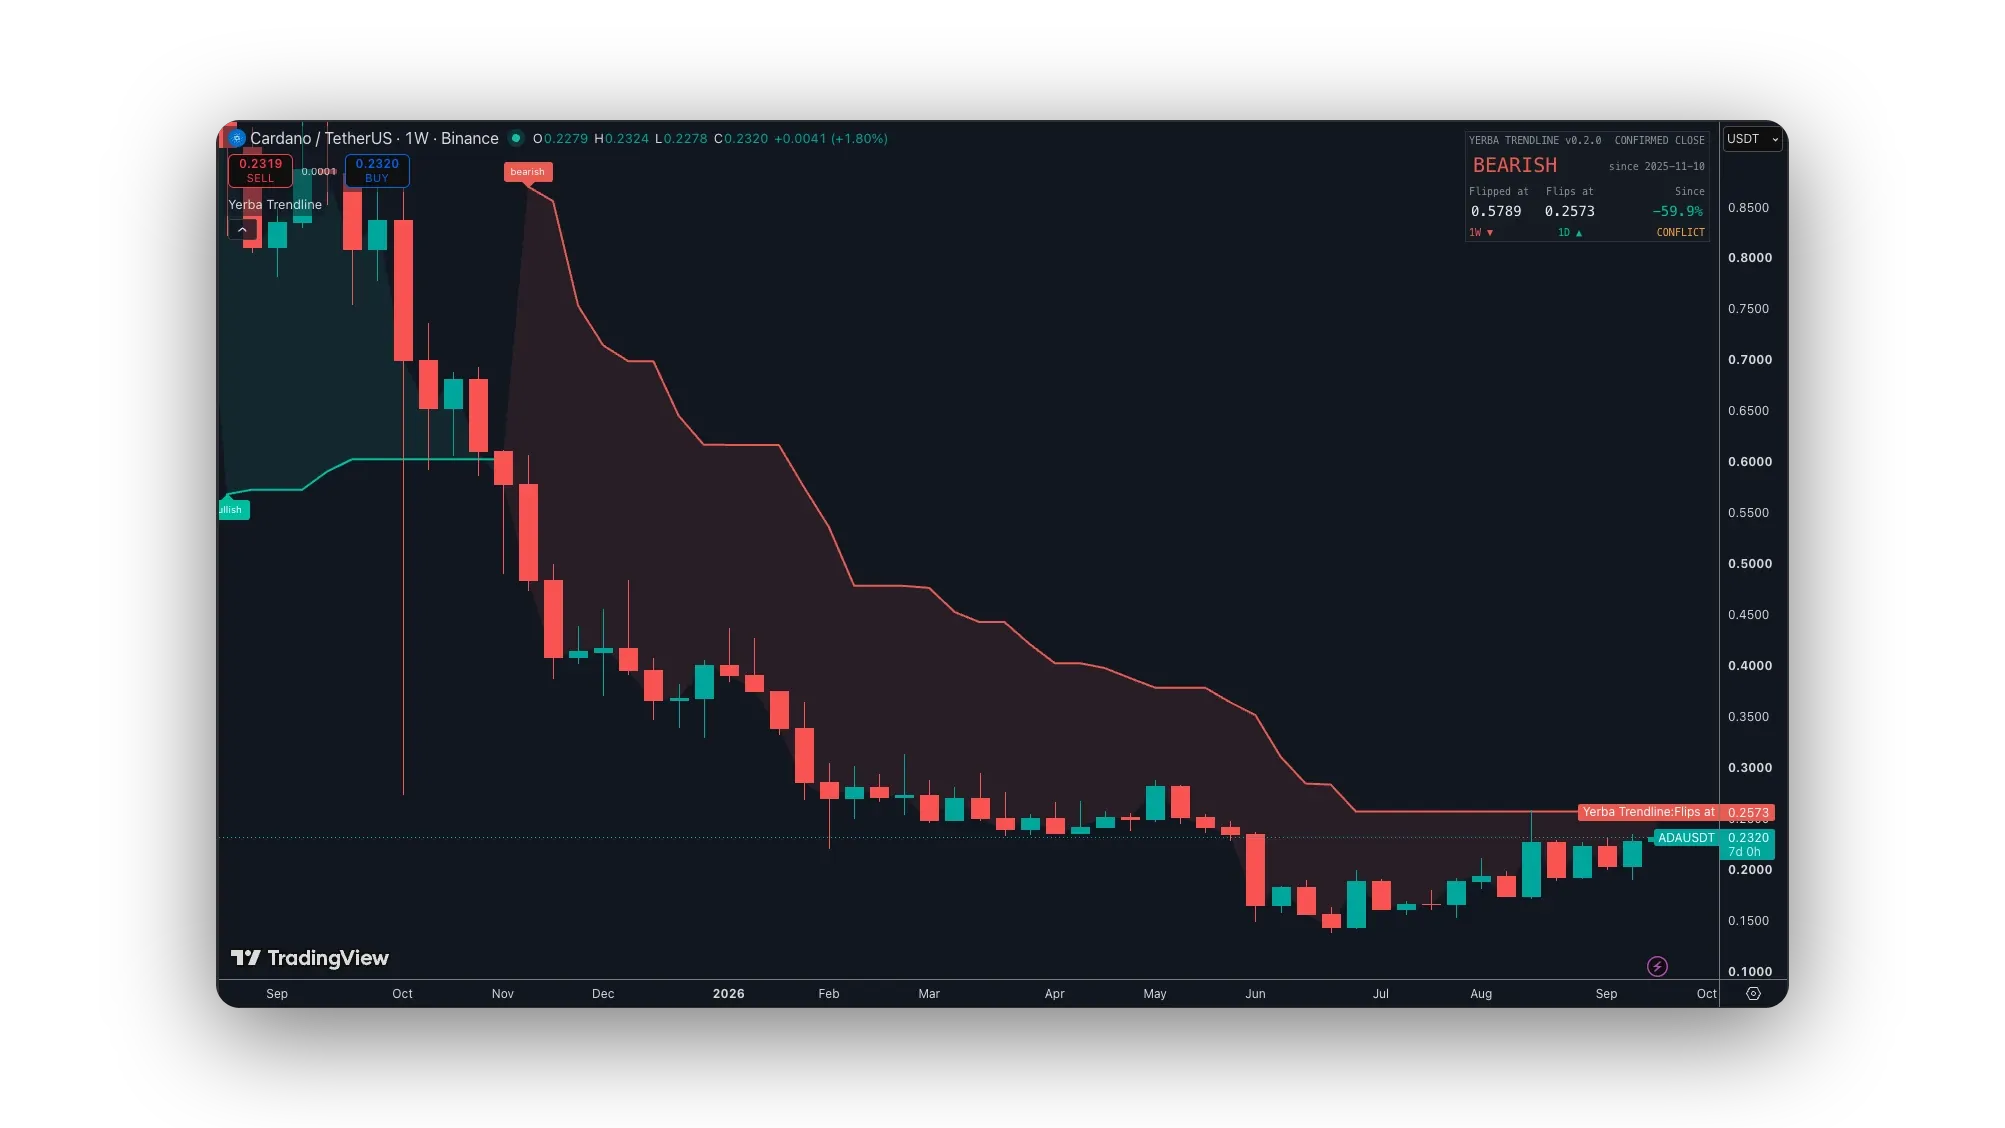
Cardano, weekly, captured 2026-09-20. Ten months bearish, price 59.9% below where the trend started, and the daily has just turned up. The weekly needs a close above 0.2573 to agree. This one runs on the defaults: ADA still fits no pair of its own.
Built for the weekly chart
Every number in Yerba Trendline was measured on weekly bars, and the idea behind it, one decision a week confirmed on the close, only really holds there.
It still runs on any timeframe TradingView can draw. Put it on a daily chart and you get the same line, the same card and the same alerts, stepping on daily closes instead of weekly ones. Two things change, and both are worth knowing:
- The per-asset pair stops being the right pair. Those two numbers were fitted on weekly bars. On a faster chart they’re just numbers that happen to be there, so the line flips far more often and none of those flips have been tested.
- The card compares your chart to one step down. On a weekly chart the rows read 1W and 1D. On a daily chart they read 1D and 1H. The ladder is 1W, 1D, 1H, 15m, 5m, 1m.
Nothing stops you from running it lower. Switch the automatic pair off, type your own two numbers, and it’s yours. It just hasn’t been measured there, and I’d rather tell you than let you find out.
The terms, short
Sold as is. All sales are final, with one exception: if the file won’t compile in a current TradingView Pine editor and I can’t fix it within 14 days of your report, you get a full refund. Updates are included for as long as I keep developing it, with no promised cadence. Support through the contact form, best effort. One buyer, personal use: don’t share it, resell it, or publish it on TradingView. The full licence and risk disclosure are on this site, and the same two documents come inside the download.
None of this is investment advice. It’s a trailing stop that tells you where it is. What you do at that price is yours.
Buy Yerba Trendline
USD 97
One-time purchase. Every update included.
Buy now- You get
- The Pine script file, ready to paste into TradingView.
- Setup
- Open TradingView's Pine editor, paste the file, add it to your chart. About a minute.
- Works on
- Any TradingView plan. The three flip alerts need Essential or higher, which is TradingView's rule for alerts on any indicator.
- Updates
- Included. New versions download from the same link.
Please read the terms before you buy. Questions? Leave me a message.